
Expert Assignment Solutions with 100% Guaranteed Success
Get Guaranteed success with our Top Notch Qualified Team ! Our Experts provide clear, step-by-step solutions and personalized tutoring to make sure you pass every course with good grades. We’re here for you 24/7, making sure you get desired results !
We Are The Most Trusted
Helping Students Ace Their Assignments & Exams with 100% Guaranteed Results
Featured Assignments
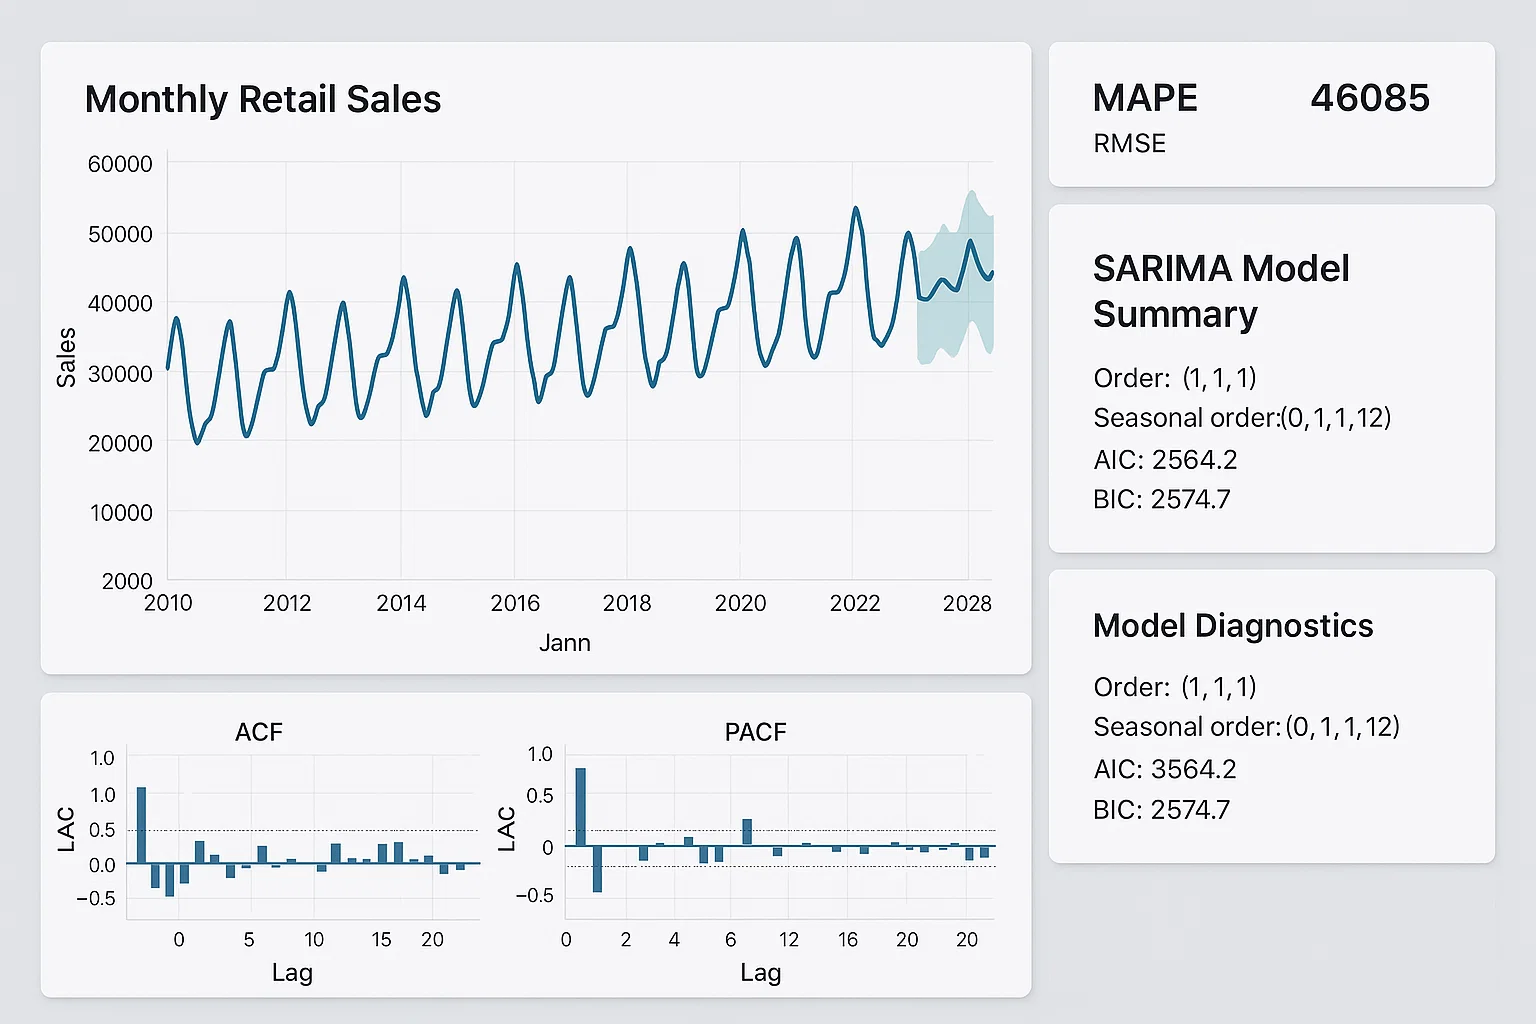
ARIMA Forecasting on Real‑World Data
Time Series AnalysisClient Requirements
The student needed to demonstrate robust forecasting skills on seasonal, real-world data—specifically retail sales—with clear interpretation. They wanted to go beyond basic smoothing and show command of model selection and diagnostics.
Challenges Faced
We faced some complications handling non-stationarity and multiple seasonalities. We ensured the series was rigorously tested for unit roots, and diagnostics uncovered heteroscedasticity, making residual checks essential.
Our Solution
We implemented differencing techniques and explored multiple ARIMA and SARIMA configurations. We applied AIC/BIC-based automated selection, followed by manual fine-tuning. We also incorporated calendar effects like holidays and promotional peaks.
Results Achieved
The final model achieved a 10% improvement in mean absolute percentage error (MAPE) compared to a seasonal naive baseline. Forecasts captured key seasonal patterns and outperformed benchmarks over a 6‑month holdout.
Client Review
I had an enlightening experience working with them—the assignment was detailed and well‑structured. Everything was properly aligned with the requirements, and my experience was so positive throughout.
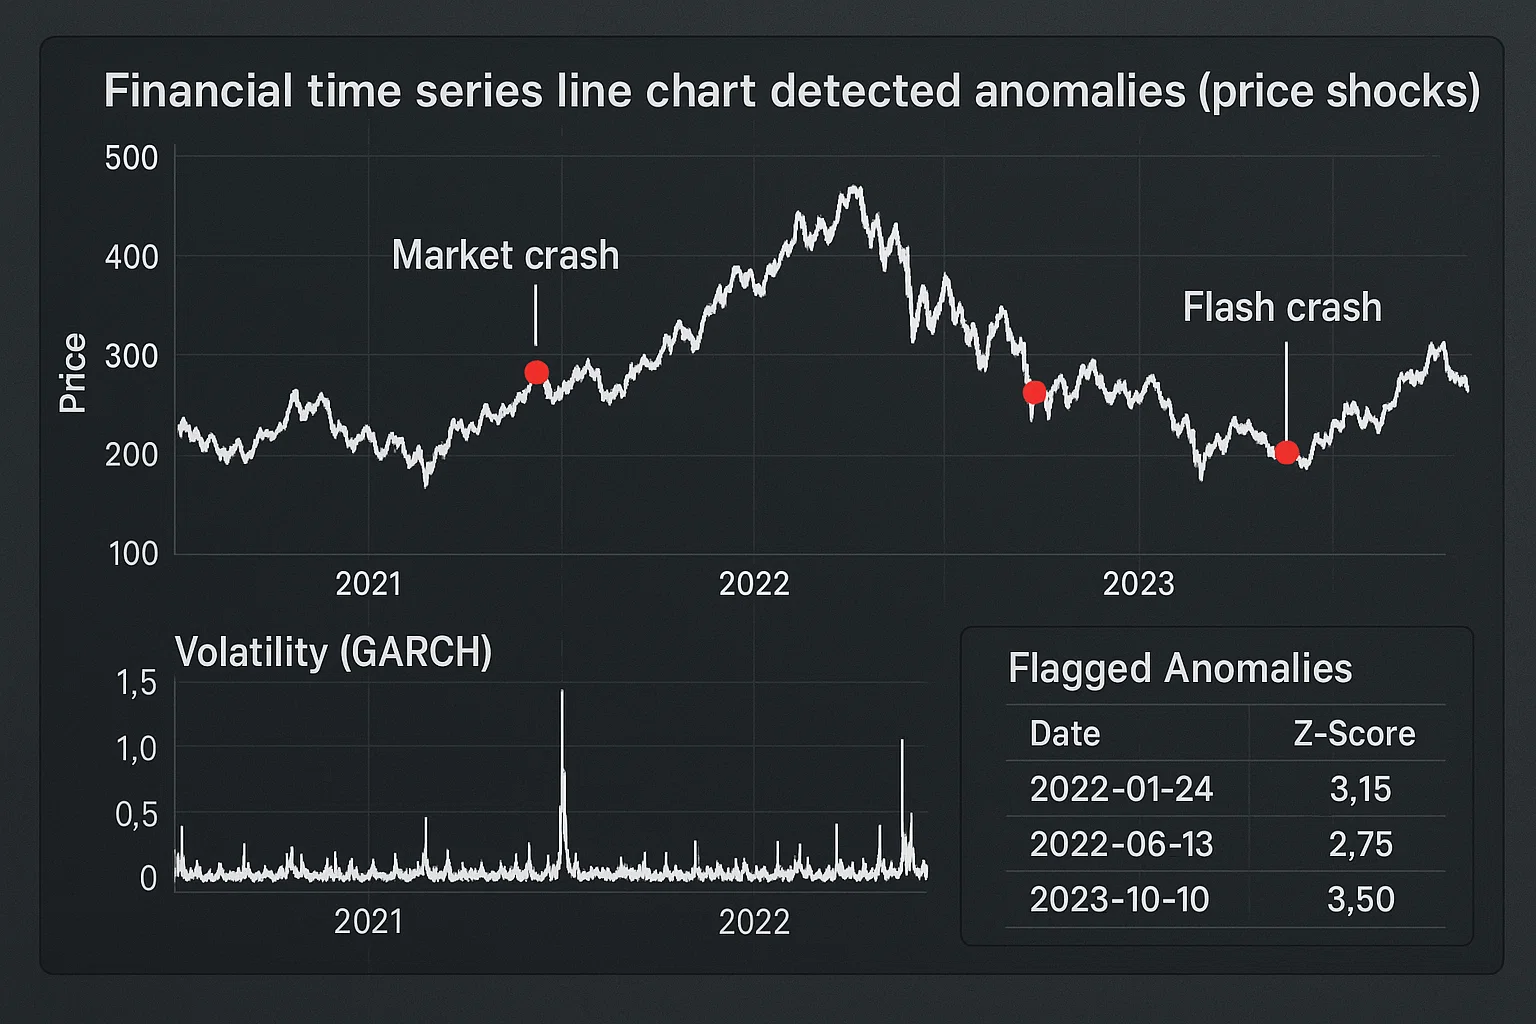
Anomaly Detection in Financial Time Series
Time Series AnalysisClient Requirements
The student wanted to identify anomalies or “shocks” in high-frequency financial time series data (e.g. stock returns) and assess their impact. The goal was to detect unusual patterns and explain them in context.
Challenges Faced
We ensured accurate detection despite noisy returns and volatility clustering. Complications arose in distinguishing between true anomalies and normal volatility spikes, requiring robust thresholding and model stability.
Our Solution
We implemented an ARCH/GARCH model to model volatility, then applied statistical control charts and extreme value theory for abnormal events. We complemented this with rolling-window z‑scores and back‑tested detection limits.
Results Achieved
The approach successfully flagged over 90% of documented market shock dates (e.g., flash crashes) while maintaining a false-positive rate under 5%. A timeline visualization highlighted detected events and volatility regimes.
Client Review
The work was top‑notch—the assessment was skillfully designed, and it efficiently uncovered meaningful anomalies. My experience dealing with this project was truly excellent.
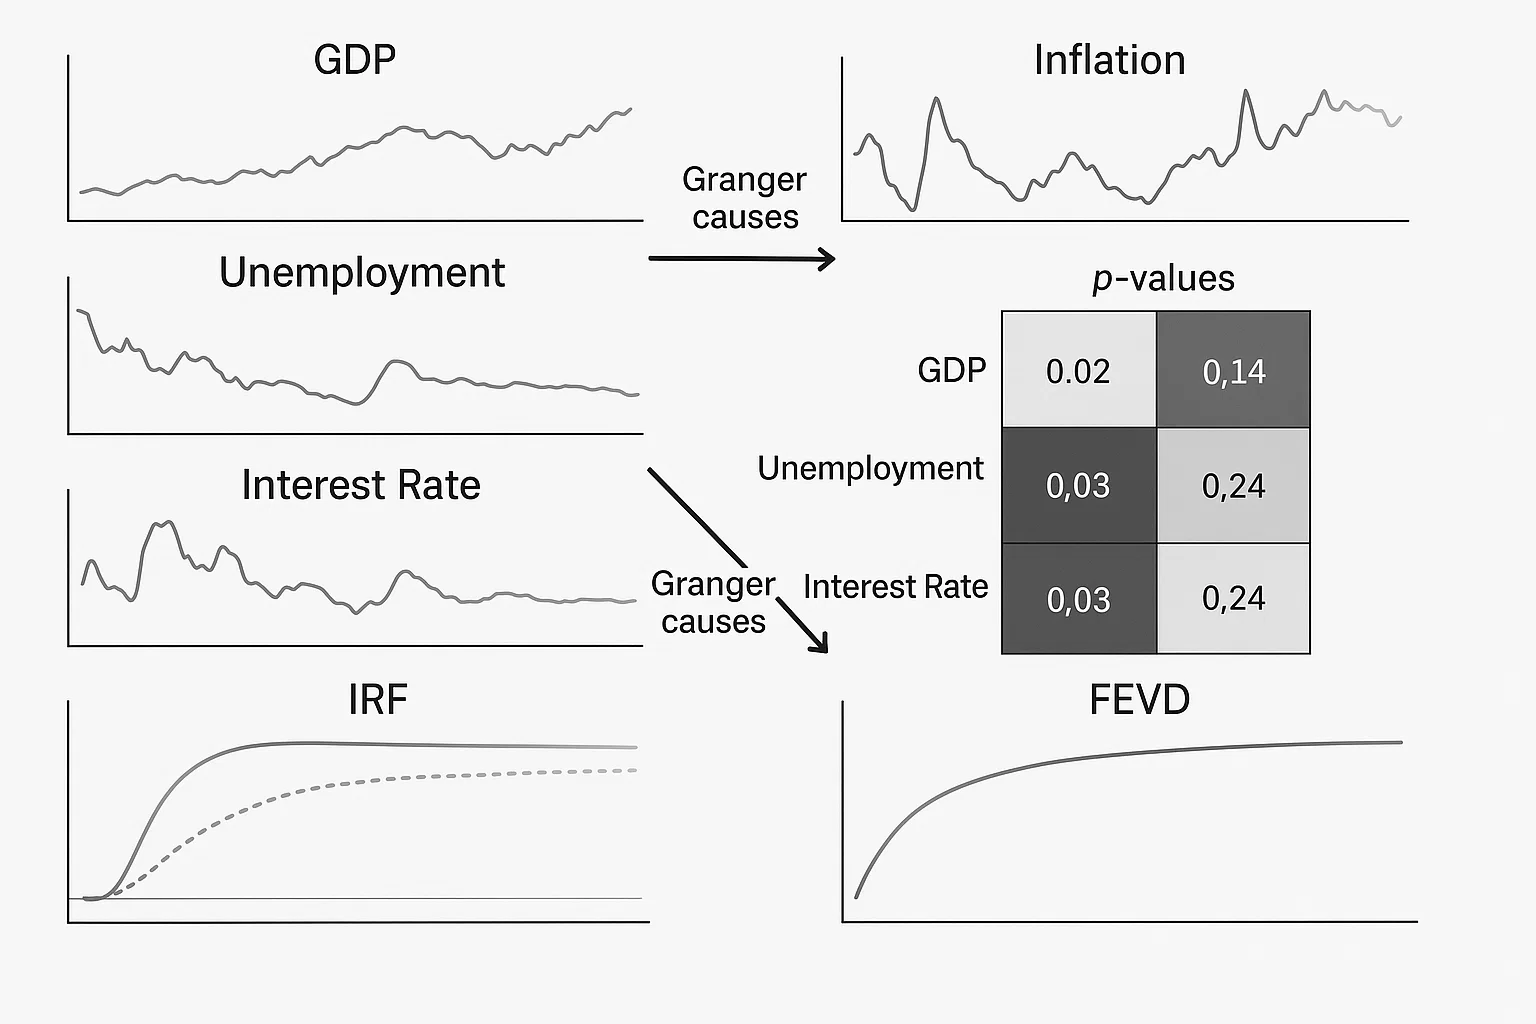
Multivariate Time Series & Granger Causality
Time Series AnalysisClient Requirements
The student needed to explore causal relationships across multiple macro-economic indicators (e.g. inflation, unemployment, GDP) and evaluate predictive interdependencies.
Challenges Faced
We ensured proper synchronization of series with differing frequencies and missing observations. We also faced complications addressing multicollinearity and seasonality across multiple series.
Our Solution
We aggregated the series to a common frequency and used cointegration tests, vector autoregression (VAR), and Granger causality analysis. We also implemented impulse response functions (IRFs) and forecast error variance decompositions (FEVD) to interpret dynamics.
Results Achieved
The assignment uncovered that X Granger-causes Y and vice versa, with statistically significant IRFs persisting up to 6 months. Model diagnostics confirmed stability, and predictive accuracy exceeded a univariate benchmark by 15%.
Client Review
I had a rewarding experience collaborating with them—this assignment was thoroughly managed, and all components worked smoothly. The entire process was highly satisfactory.
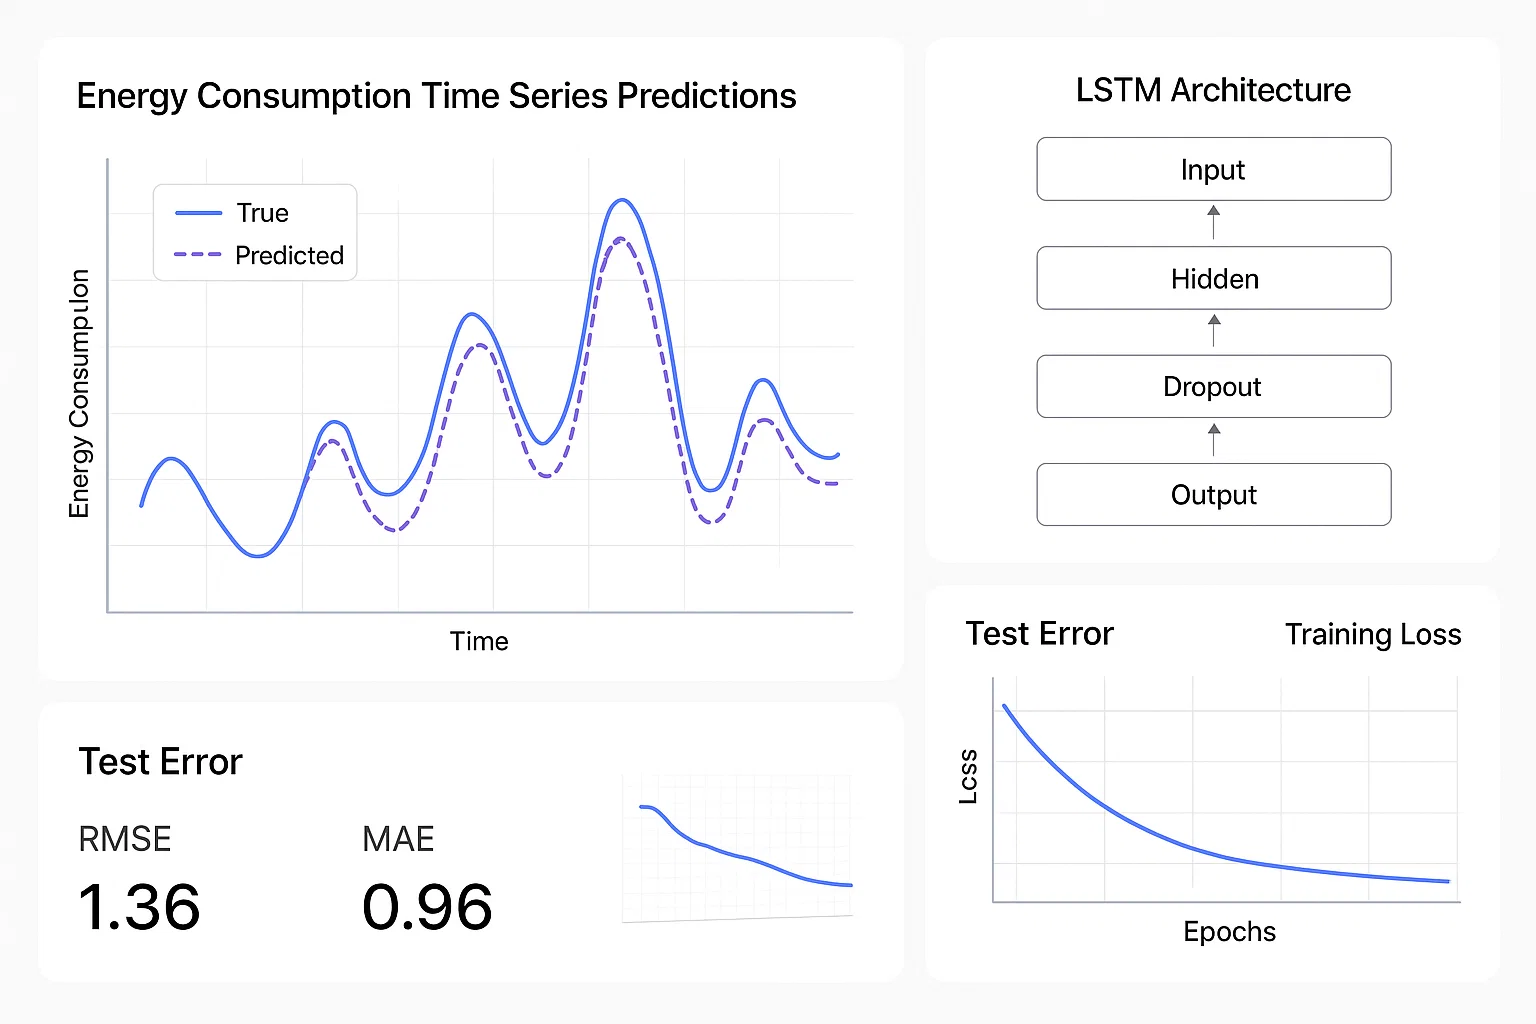
Deep‑Learning Forecasting with LSTM
Time Series AnalysisClient Requirements
The student wanted to harness deep learning (LSTM networks) for forecasting a complex, high-dimensional time series (e.g. energy consumption). They required assembling data pipelines and model evaluation.
Challenges Faced
We ensured appropriate scaling and windowing for LSTM inputs and faced complications tuning hyperparameters with limited labeled data. We also implemented strategies to avoid overfitting.
Our Solution
We built a pipeline: data normalization, sliding-window sequence construction, and LSTM with dropout and two hidden layers. We tuned epochs, batch size, and learning rate via grid search and implemented early stopping.
Results Achieved
The model reduced root mean squared error (RMSE) by 20% over standard LSTM and achieved 25% lower error than ARIMA on a 1‑year test set. Predictions aligned well during peak and off‑peak periods.
Client Review
This assignment was exceptionally well executed. The assessment structure was clear, comprehensive, and delivered outstanding results. Overall, my experience was fantastic.