
Expert Assignment Solutions with 100% Guaranteed Success
Get Guaranteed success with our Top Notch Qualified Team ! Our Experts provide clear, step-by-step solutions and personalized tutoring to make sure you pass every course with good grades. We’re here for you 24/7, making sure you get desired results !
We Are The Most Trusted
Helping Students Ace Their Assignments & Exams with 100% Guaranteed Results
Featured Assignments
Implementing a Data Preprocessing Pipeline
Data ScienceClient Requirements
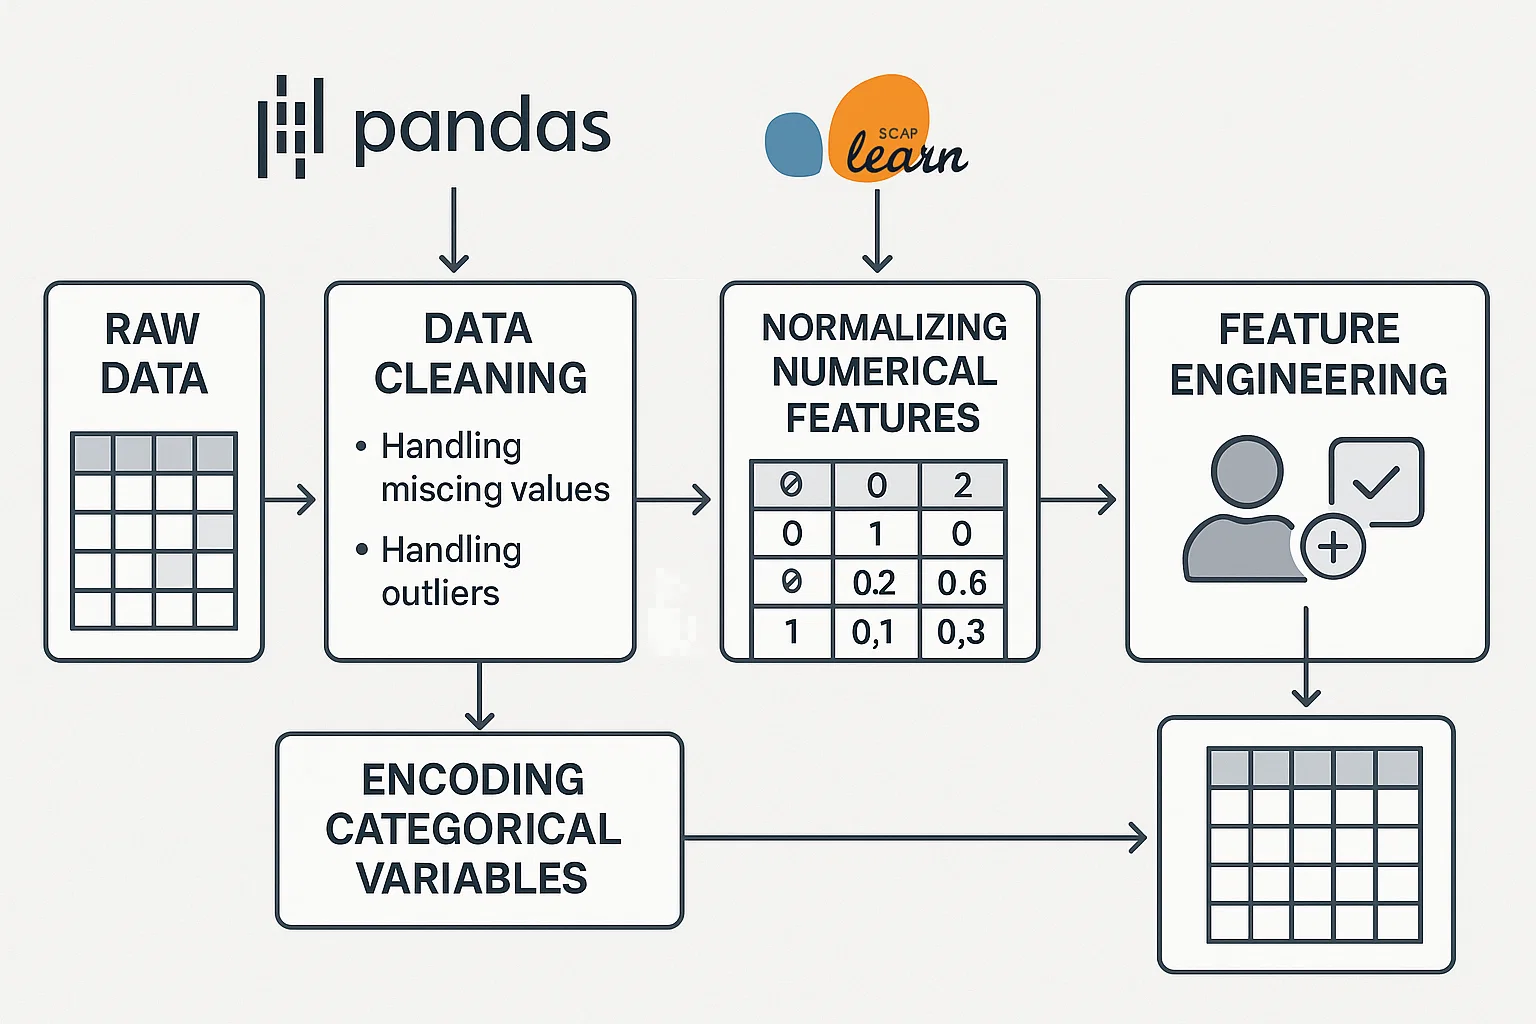
The student needed to build a data preprocessing pipeline for a large dataset that includes missing values, outliers, and irrelevant features. The task required the student to clean the data, handle categorical variables, normalize numerical values, and address any inconsistencies. They were asked to use Python libraries like Pandas, NumPy, and Scikit-learn to automate the preprocessing steps and ensure the data was ready for machine learning.
Challenges Faced
We ensured that students understood the importance of data preprocessing, but they faced complications when dealing with large datasets and efficiently cleaning them. Handling missing values and selecting the best strategy for imputation was a challenge. Additionally, some students struggled with encoding categorical variables and ensuring they didn't lose important information while normalizing and scaling the data.
Our Solution
We guided the students through the process of data cleaning using Pandas, showing them how to handle missing values, outliers, and irrelevant columns. We introduced them to techniques like one-hot encoding for categorical variables, and normalization or standardization for numerical features. We also taught them how to implement pipelines using Scikit-learn to streamline the process.
Results Achieved
The students successfully implemented efficient data preprocessing pipelines, automating the process for large datasets. They effectively handled missing data, imbalanced classes, and irrelevant features, preparing the data for further analysis or machine learning modeling.
Client Review
My experience with this assignment was enlightening. Building a preprocessing pipeline taught me how crucial it is to clean data before performing any analysis. The process of handling missing values and normalizing data was more complex than I expected, but with the tools and guidance, I was able to complete it efficiently. I now feel much more confident in preparing data for any machine learning task.
Exploring Big Data with Apache Spark
Big Data AnalysisClient Requirements
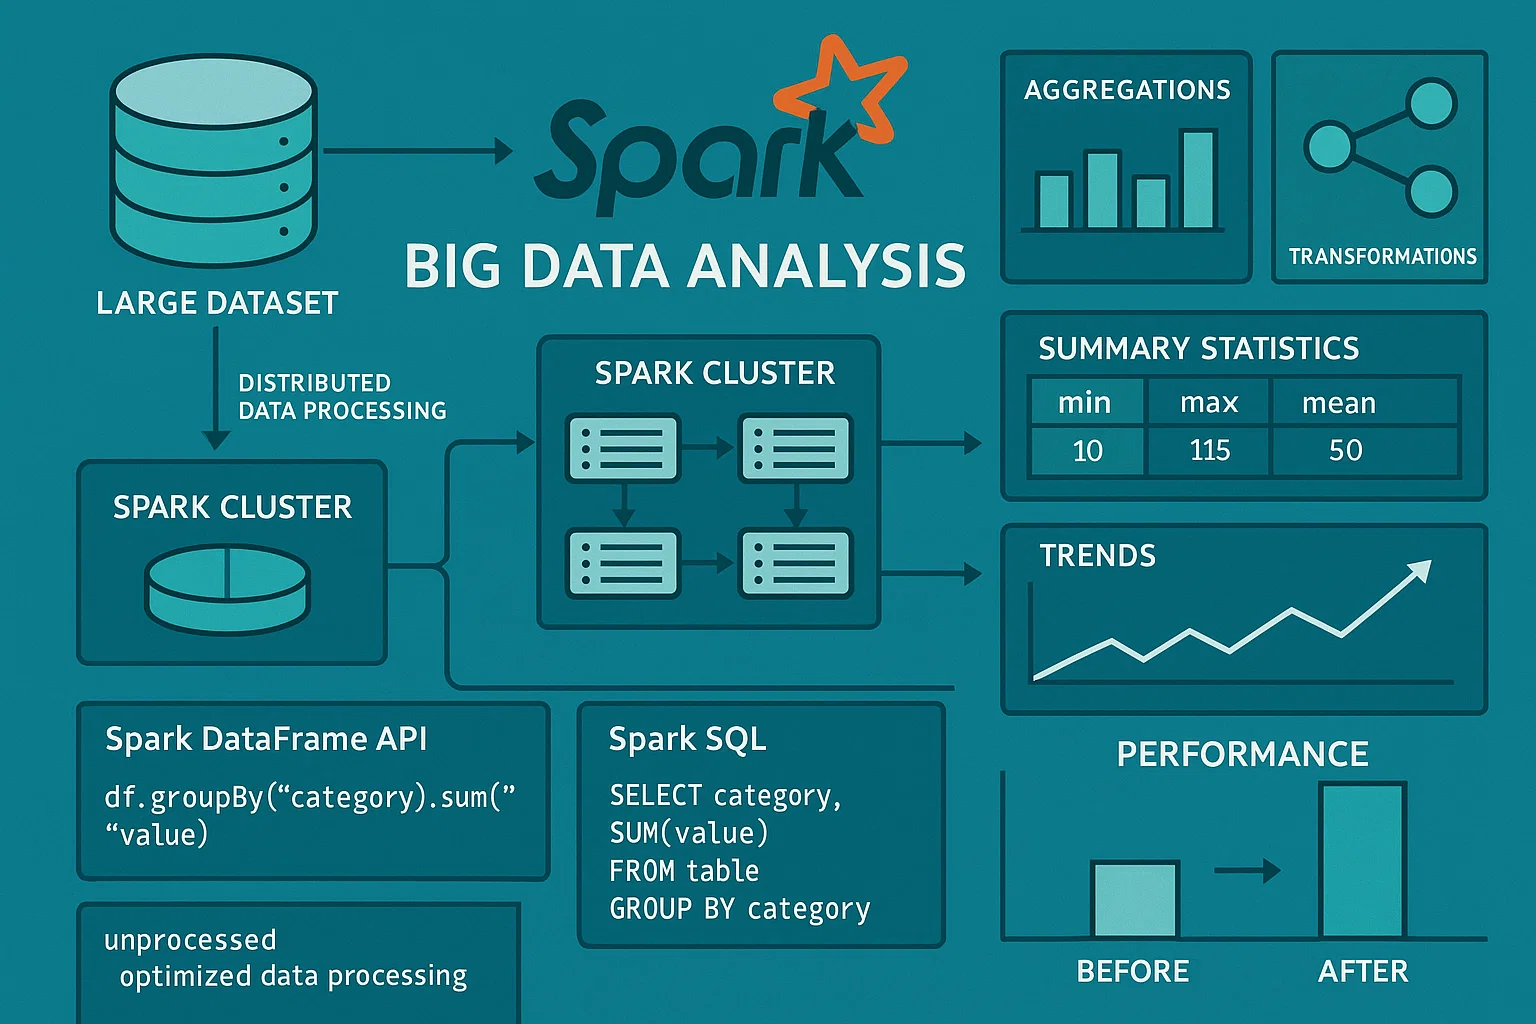
The student was tasked with analyzing a large dataset (e.g., one that exceeds a traditional system’s memory capacity) using Apache Spark. They needed to perform exploratory data analysis (EDA), aggregate the data, and visualize key trends and patterns. The goal was to use Spark's distributed computing framework to handle big data efficiently and draw insights through summary statistics and visualizations.
Challenges Faced
We ensured that students had a foundational understanding of distributed computing, but many faced challenges in setting up Spark clusters and handling large datasets. Some students struggled with data partitioning and parallel processing in Spark, which affected the performance of their analyses. Additionally, visualizing big data results was difficult due to the volume and complexity of the data.
Our Solution
We provided students with resources to understand the Spark ecosystem and taught them how to use PySpark for data analysis. We introduced them to Spark’s DataFrame API for handling structured data and Spark SQL for performing aggregations and queries. We also showed them how to visualize Spark-based data using libraries like Matplotlib and Seaborn, while ensuring they worked with smaller samples for effective visualization.
Results Achieved
The students successfully explored and analyzed large datasets using Apache Spark. They were able to perform key operations like aggregations, filtering, and summarizing data across a distributed environment. The final reports contained clear visualizations and insights derived from big data, showcasing their ability to handle and analyze large datasets using Spark.
Client Review
This assignment was challenging, but it really helped me understand how big data systems like Apache Spark work. Setting up the Spark cluster and dealing with distributed computing took some time to master, but once I understood the core concepts, it became much easier. The visualizations of large datasets were insightful, and the project gave me practical skills in handling big data.
Building a Predictive Model with Big Data
Machine Learning with Big DataClient Requirements
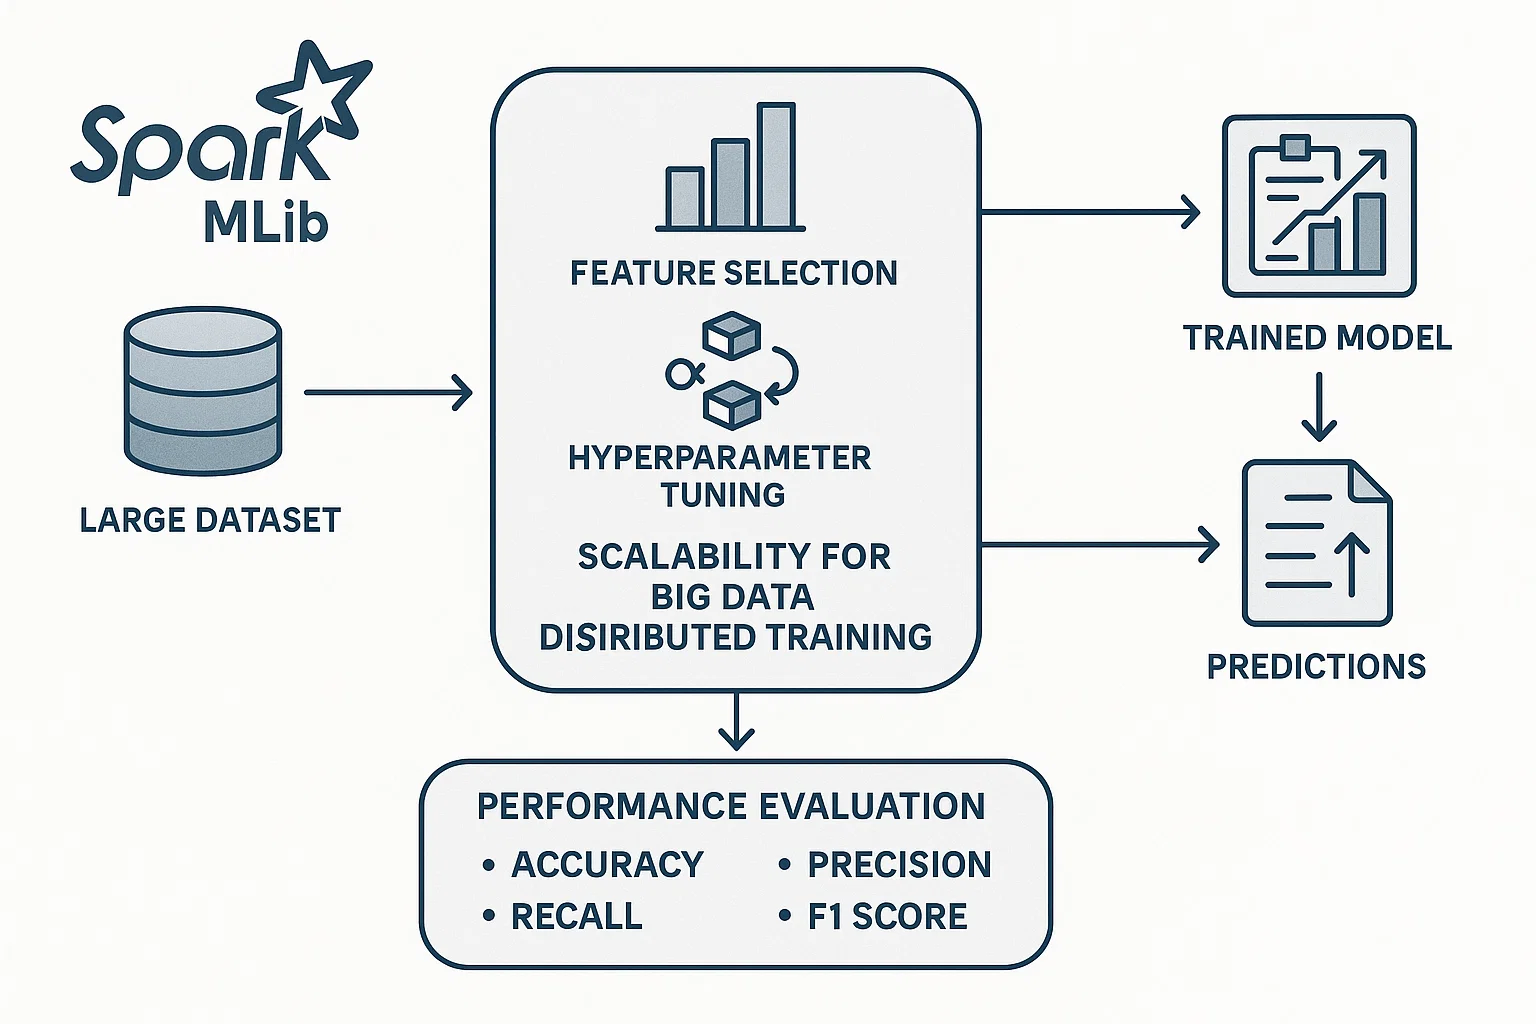
The student needed to build a predictive machine learning model using a large dataset. They were required to implement a regression or classification model using a distributed computing framework (e.g., Apache Spark MLlib) and evaluate its performance. The task also involved feature engineering, model selection, and hyperparameter tuning to ensure the model was as accurate as possible given the large-scale data.
Challenges Faced
We ensured that students understood the fundamentals of machine learning, but they faced challenges in scaling their models to handle big data effectively. Many students struggled with feature engineering on a large dataset and determining which features to include. Hyperparameter tuning was also a complex task, as students had to balance model complexity with computational resources in a distributed environment.
Our Solution
We introduced students to Spark’s MLlib for distributed machine learning tasks and guided them through the process of feature engineering, model selection, and cross-validation. We taught them how to perform hyperparameter tuning using techniques like grid search and random search, and how to parallelize the training process in Spark to efficiently work with big data.
Results Achieved
The students successfully built predictive models using Spark MLlib, ensuring they were optimized for large datasets. They applied feature selection techniques, tuned hyperparameters, and evaluated their models’ performance based on metrics like accuracy, precision, recall, and AUC. The models demonstrated scalability and solid predictive power on big data.
Client Review
This assignment pushed me to learn how to apply machine learning to large datasets using Spark. It was an eye-opening experience to scale a model to big data and understand the challenges that come with it. The guidance on feature engineering and hyperparameter tuning was invaluable, and I now have a deeper understanding of building scalable machine learning models.
Data Visualization for Big Data Insights
Data Visualization for Big DataClient Requirements
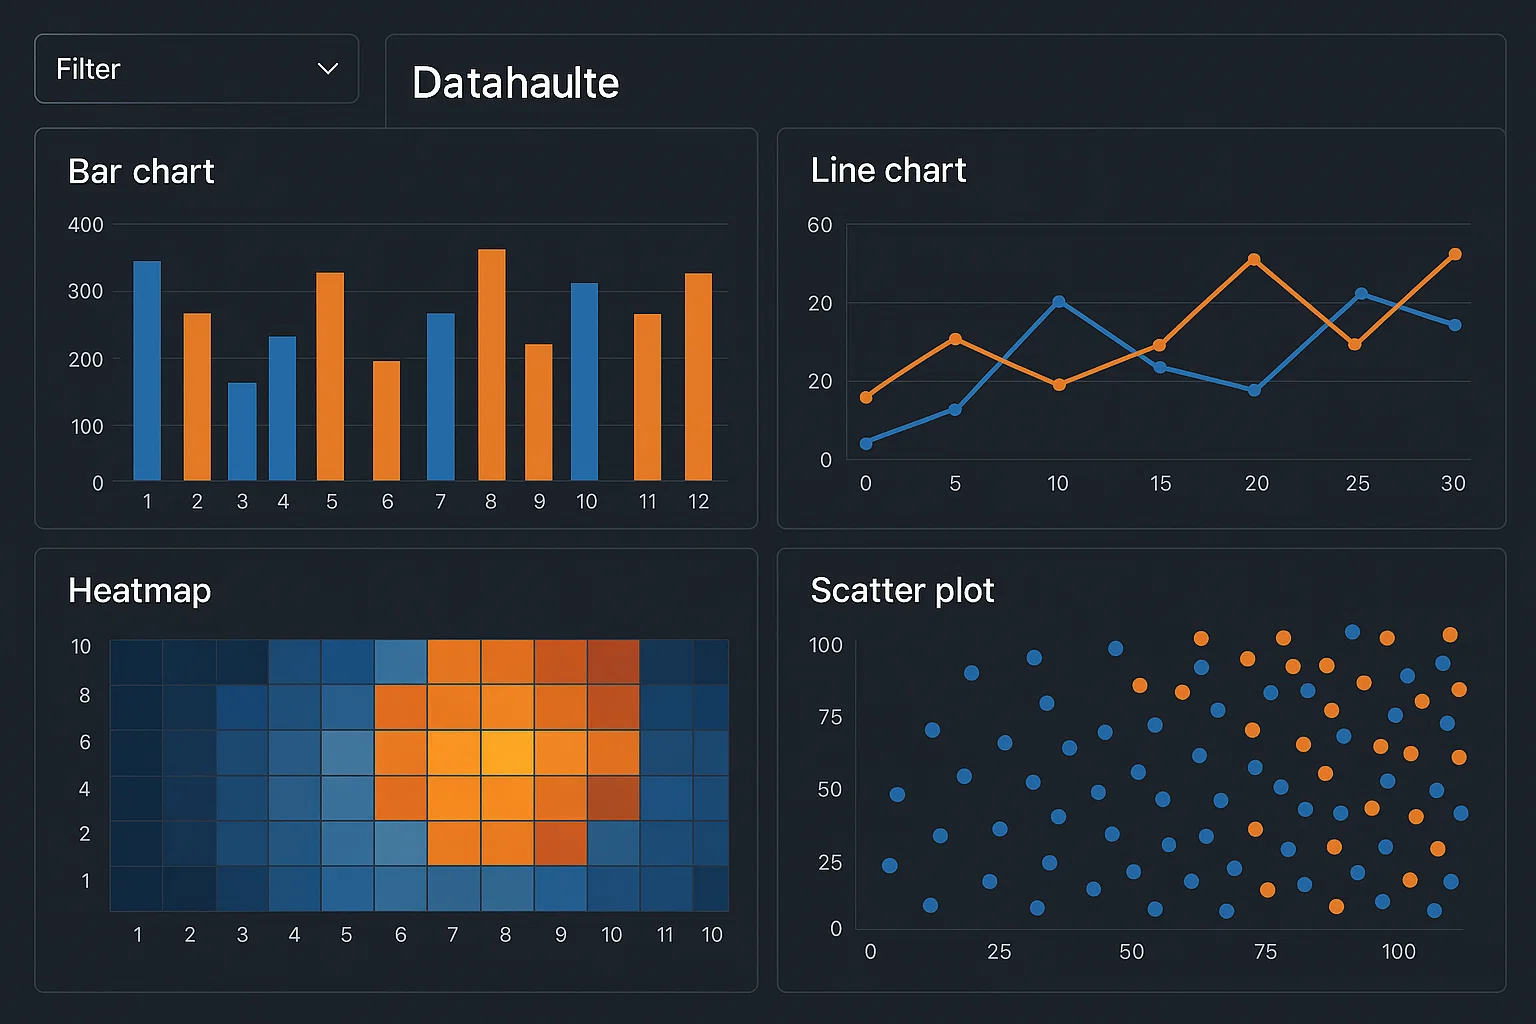
The student needed to create an interactive data visualization dashboard for a large dataset, with the goal of uncovering insights. The student was required to use visualization tools like Tableau, Power BI, or Python libraries such as Matplotlib, Seaborn, or Plotly. The dashboard had to allow for the exploration of key trends, with the ability to filter and drill down into various aspects of the data, showcasing patterns and correlations.
Challenges Faced
We ensured that students had a basic understanding of data visualization, but many found it challenging to effectively present large datasets. Some students struggled with choosing the right visualizations to represent big data insights and encountered difficulties with performance when visualizing very large datasets. Ensuring the interactivity of the dashboard while maintaining usability was also a complex task.
Our Solution
We provided students with best practices for data visualization, focusing on choosing the appropriate visualization types for big data (e.g., heatmaps, scatter plots, time series). We guided them in using Python libraries like Plotly for interactive plots or helping them create Tableau/Power BI dashboards that enabled filtering and drilling down into the data. Performance optimization techniques for visualizations were also introduced to handle large datasets efficiently.
Results Achieved
The students successfully created interactive dashboards that provided valuable insights from big data. They effectively visualized large datasets, revealing trends and patterns that were not immediately apparent. The final projects showcased an understanding of data visualization principles and the ability to create engaging, user-friendly visualizations for big data.
Client Review
Creating a data visualization dashboard for big data was an incredibly rewarding experience. I learned how to choose the right visualizations to represent large datasets and how to make interactive dashboards that allowed users to explore the data. The process of optimizing performance for big data visualizations was challenging, but the results were extremely satisfying. I now feel more confident in visualizing big data effectively.